User Interface
At its heart, Oniro IDE is a code editor. Like many other code editors, Oniro IDE adopts a common user interface and layout of an explorer on the left, showing all of the files and folders you can access, and an editor on the right, showing the content of the files you have opened.

Basic Layout
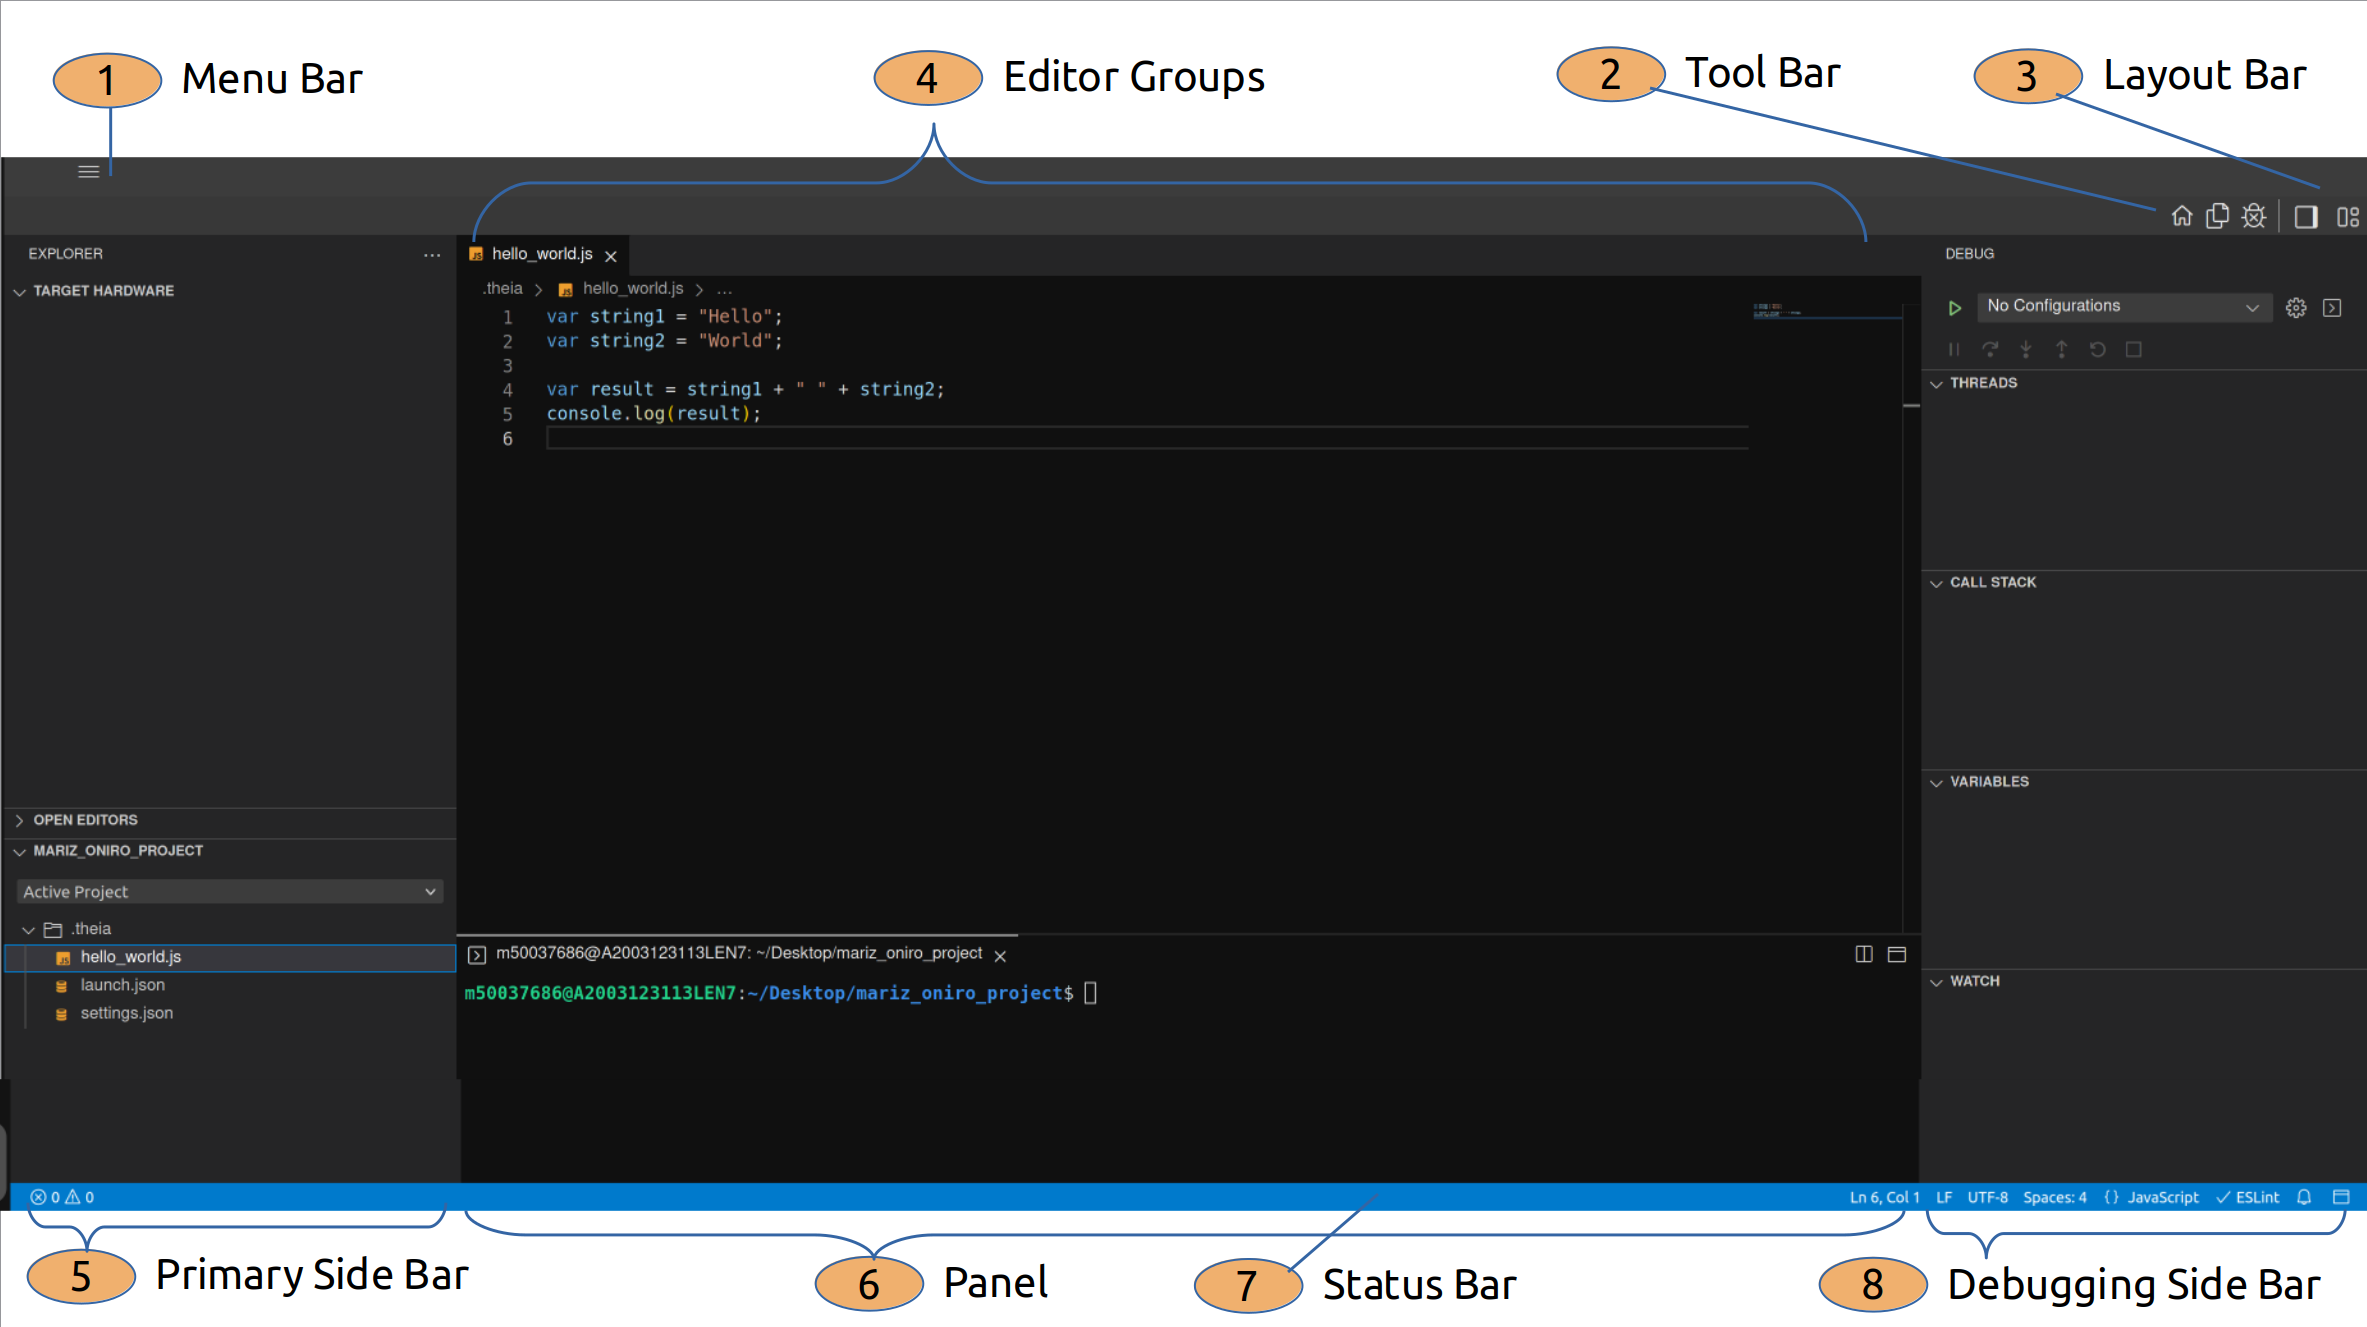
The basic layout consists of 8 main areas:
- Menu Bar: that contains the main menus such as File, Edit, View, Run..etc.
- Tool Bar: for going home, and toggling the explorer and debugging side bars.
- Layout Bar: for changing the layout and positioning of the tool bar.
- Editor Groups: with all the different files you are editing. You open as many files as you want and stack them horizontally and vertically.
- Primary Side Bar: usually hosts the
Explorerview to assist you in navigating and working on your project. - Panel: space for views below the editor area. It typically has the integrated terminal, output and errors. You can also stack multiple views in the panel or have it as a pop out in a separate window.
- Status Bar: shows the status of the file you are currently editing such as the language used in the file.
- Secondary Side Bar: hosts an extra view on the right hand side such as a
Debuggingside bar.
Explorer
The explorer is used to browse, open, and manage all the files and folders in your project. You can create a new file or folder at any time in your project.
You can do many things to files and folders in the explorer:
- Create, delete, rename files and folders by right click.
- Move files and folders by drag and drop.
- Duplicate, copy and paste files into a folder.
You could run commands in a folder by right clicking on the folder itself or a file in the folder and choosing
Open in Terminalfrom the pop out menu.
Open Editors
On the top of the Explorer side view you can find a pane called Open Editors that shows all the files that you currently have open. This allows for quick navigation between the opened editor tabs.
Views
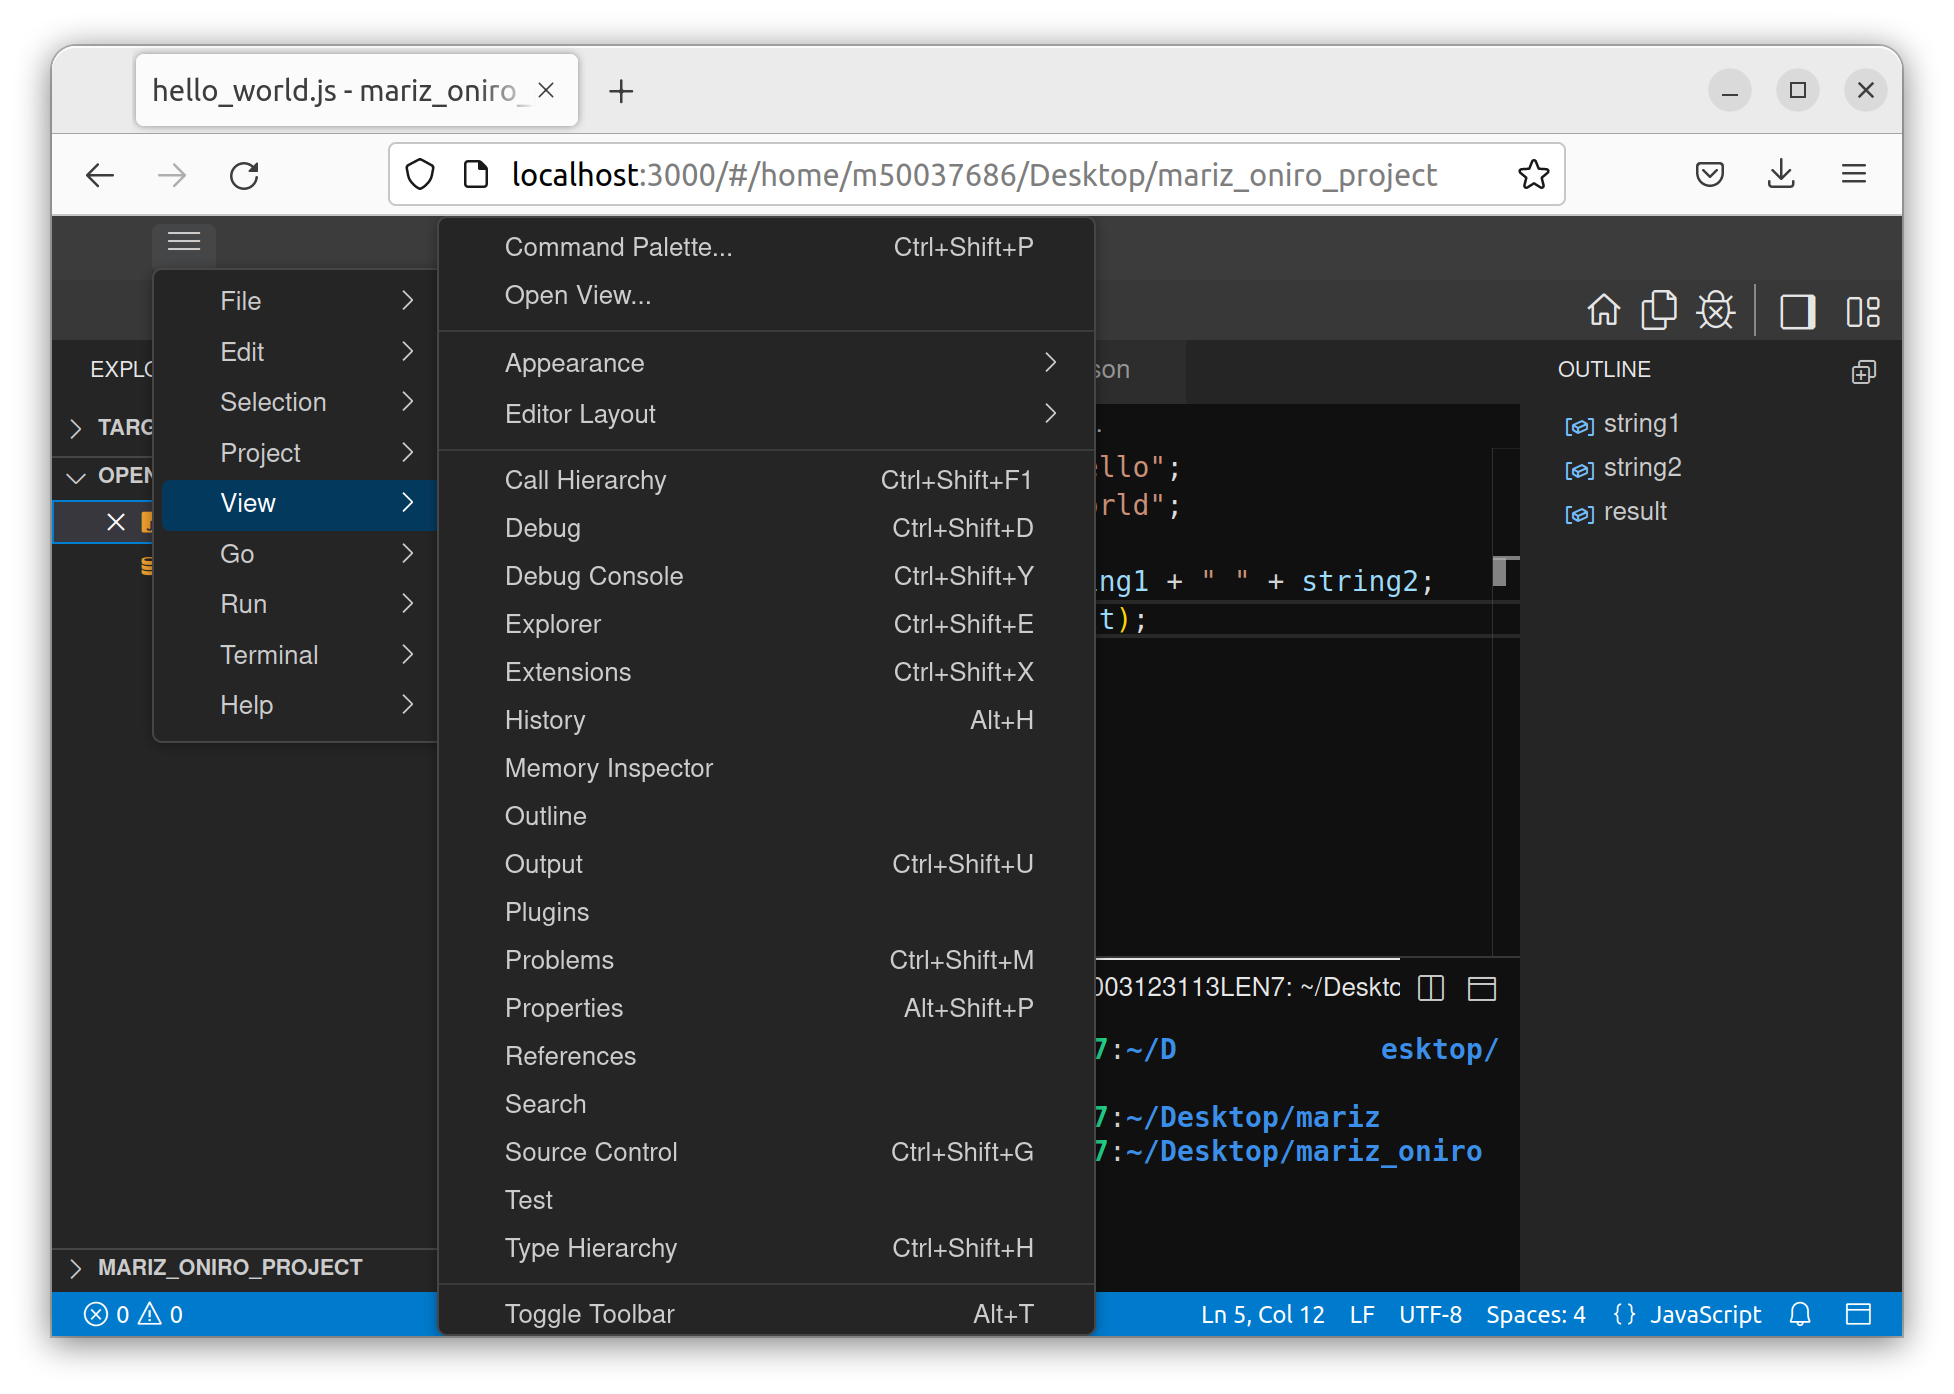
The Explorer is one of multiple other views available in Oniro IDE.  By navigating to
 View from the menu bar, you can see the multiple views that can be opened, such as:
- Search Provides global search and replace across your open folder.
- Debug for debugging tools displaying the
Call Stack,Variables,Breakpointsthroughout the code, and aWatchmonitoring select variables. - Outline shows a symbol tree of the currently active editor showing the variables in your code.